QuickDip dipmeter interpretation software

Dipmeter Interpretation


  • Interpretation of dipmeter data using SCAT techniques 
  • Commands accessible from menus or toolbar 
  • Imports ASCII format dipmeter log data 
  • Plot dip versus azimuth, tangent plots and longitudinal/transverse projections 
  • Fit data with theoretical fold curves for cylindrical and conical folds

 
QuickDip is an easy to use program for the interpretation of dipmeter data using statistical curvature analysis techniques (SCAT). The main menu items are accessible from the QuickDip Toolbar. QuickDip supports import of dipmeter data from ASCII files and allows the user to save interpretation project files.

(dipmeter interpretation, dipmeter SCAT analysis)

QuickDip Features

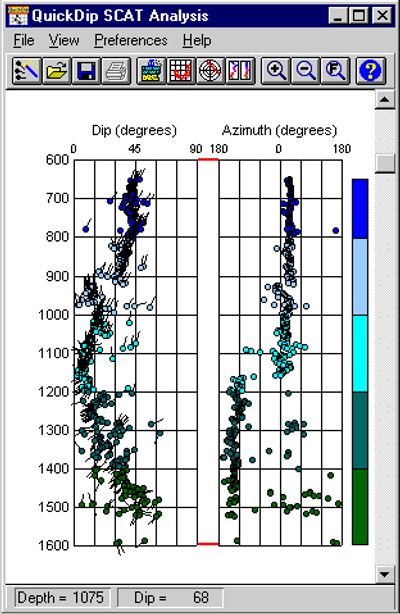
Dip and Azimuth versus Depth Plot


The dip and azimuth versus depth plot is useful for identifying dip domains as well as faults and folds. Depth intervals can be color coded by clicking on the color bar and dragging the color boundaries to the desired locations. Horizon labels can be added and displayed to aid interpretation. Specific depth intervals can be displayed using the zoom tool. 

image4

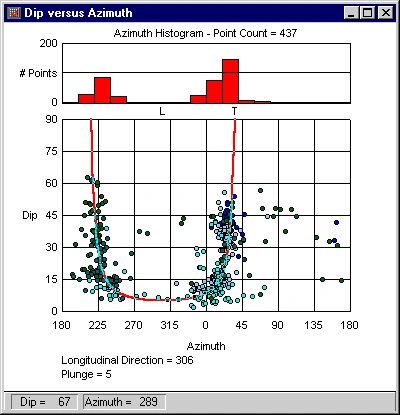
Dip versus Azimuth Plot


The dip versus azimuth plot allows the easy identification of fold forms. The "horseshoe" shaped theoretical fold curve can be visually fit to the data by simply clicking and dragging on the plot. The longitudinal direction and plunge of the fold can then be estimated. The histogram on the plot shows the total number of points in each bin. 
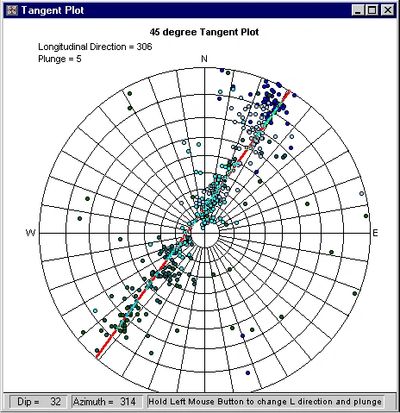
image5

Tangent Plot


The tangent plot is also useful for identifying folds. Cylindrical folds plot as a straight line on the tangent plot. The theoretical fold curve can be visually fit to the data by clicking and dragging on the plot. 

image6

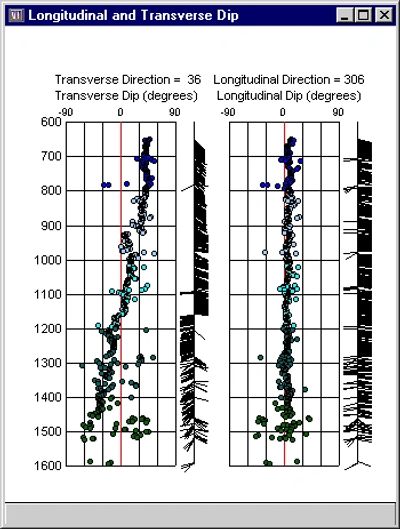
Transverse and Longitudinal Dip versus Depth Plot


The transverse and longitudinal dip versus depth plot shows the dip components in the transverse and longitudinal directions. Crestal and troughal planes are indicated at depths where transverse dip crosses zero as shown in the example below at about 1155 feet (the depth where transverse dip changes direction). 

image7

Save and retrieve Interpretations


The Save Interpretations command saves an all parameters associated with an interpretation including the name, depth interval, colors, and theoretical fold parameters. The Retrieve Interpretation command allows the interpretation to be retrieved by name. All plot parameters are restored for the retrieved interpretation.

Save Project


The Save Project command or toolbar button saves an interpretation project to a project file. The file includes all interpretations and parameters settings.

Zoom, Unzoom and Full Range


The Zoom tool allows the user to zoom on a depth interval on any depth plot. The Unzoom tool returns the display to previous zoom levels. The Full Range tool resets all displays to the full depth range of the log. 

Horizons and Formation Tops


Up to 20 horizons may be labeled on depth plots. Horizons can be input from an ASCII file or entered and saved using the Horizons dialog.

Parameter Control


With QuickDip, the user has full control over most parameters including: symbol size, # of colors, colors, # of histogram bins, limit of tangent plot, show tadpoles, show theoretical curves, curve width, and show horizons. 

Download demo or purchase Quickdip


QuickDip Requires Windows

QuickDip - $395              QuickDip Demo - Free

Contact GeoTools at carl@geotoolsco.com to order QuickDip

QuickDipDemo (zip)

Download